
PUMPA - SMART LEARNING
எங்கள் ஆசிரியர்களுடன் 1-ஆன்-1 ஆலோசனை நேரத்தைப் பெறுங்கள். டாப்பர் ஆவதற்கு நாங்கள் பயிற்சி அளிப்போம்
Book Free DemoObserve the following bar graph and answer the following based on the data provided:
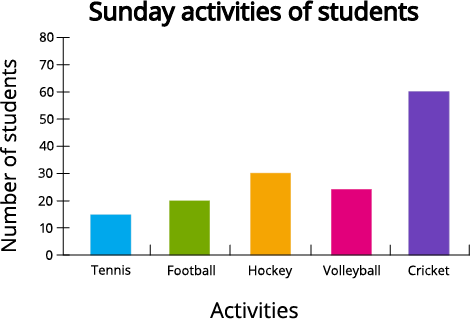
1. Which activity is least preferred?
2. The number of students who preferred football as a Sunday activity is .
3. The total number of students who preferred football and cricket is
4. What is the difference in the number of students who preferred volleyball and football?
 Register for free to see more content