
PUMPA - SMART LEARNING
எங்கள் ஆசிரியர்களுடன் 1-ஆன்-1 ஆலோசனை நேரத்தைப் பெறுங்கள். டாப்பர் ஆவதற்கு நாங்கள் பயிற்சி அளிப்போம்
Book Free DemoLet us consider the data table given below and try to construct a histogram step-by-step.
Problem:
A private organization surveyed hundred schools in Chennai. The organization collected the average number of kindergarten children in each classroom.
The data table looks like this:
Number of students | 25 - 30 | 30 - 35 | 35 - 40 | 40 - 45 | 45 - 50 |
Frequency | 15 | 35 | 18 | 25 | 7 |
Now, let us try to construct a histogram.
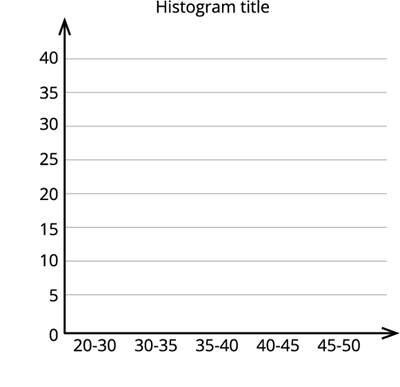
Step 1: Set and mark the units for X-axis and Y-axis.
Here, the axes will look like this:
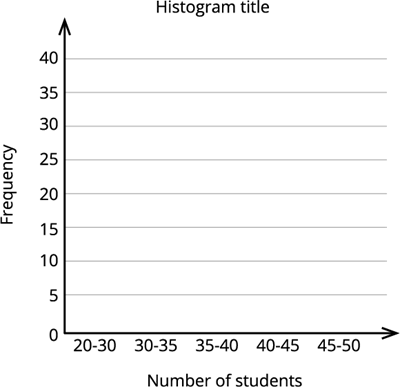
Step 2: Now mark the class intervals (Number of students) along the X-axis and the frequency along the Y-axis.
Step 3: Now, construct rectangles with class intervals (number of students) as the base and the frequency as the height.

 Register for free to see more content