
PDF chapter test TRY NOW
The pie chart on the right shows the result of a survey carried out to find the modes of travel used by the children to go to the school. Study the pie chart and answer the questions that follow.
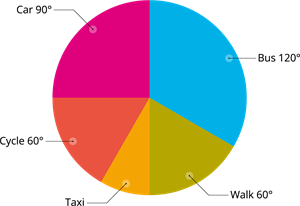
(a) What is the most common mode of transport?
(b) What fraction of children travel by car?
(c) If \(18\) children travel by car, how many children took part in the survey?
(d) How many children use taxi to travel to school?
(e) By which two modes of transport are equal number of children travelling?
 Register for free to see more content