
PDF chapter test TRY NOW
The pie chart gives the marks scored in an examination by a student in different subjects. If the total marks obtained were 540, answer the following questions.
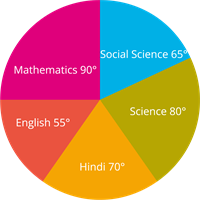
(i) In which subject did the student score 105 marks?
(ii) How many more marks were obtained by the student in Mathematics than in Hindi?
marks
 Register for free to see more content