
PDF chapter test TRY NOW
Students of a class voted for their favourite colour and a pie chart was prepared based on the data collected. Observe the pie chart and answer the questions.
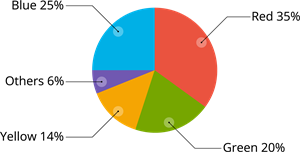
1. Which colour received \frac{1}{5} of the votes?
2. If 400 students voted in all, then how many did vote 'Others' colour as their favourite?
3. Which of the following is a reasonable conclusion for the given data?
 Register for free to see more content