
UPSKILL MATH PLUS
Learn Mathematics through our AI based learning portal with the support of our Academic Experts!
Learn moreLet us learn how to graphically solve 2 quadratic equations.
Example:
1. Draw the graph of y = x^2 + 2x - 3 and hence solve x^2 - x - 6 = 0.
Solution:
Step 1: Draw the graph of the equation y = x^2 + 2x - 3.
The table of values for the equation y = x^2 + 2x - 3 is given by:
| x | -4 | -3 | -2 | -1 | 0 | 1 | 2 |
| y | 5 | 0 | -3 | -4 | -3 | 1 | 5 |
Step 2: To solve the equation x^2 - x - 6 = 0, subtract the equation x^2 - x - 6 = 0 from y = x^2 + 2x - 3.
y = x^2 + 2x - 3
0 = x^2 - x - 6 (-)
-----------------------------
y = x + 3
-----------------------------
Step 3: Draw the graph of the equation y = x + 3.
The table of values for the equation y = x + 3 is given by:
| x | -4 | -3 | -2 | -1 | 0 | 1 | 2 | 3 |
| y | -1 | 0 | 1 | 2 | 3 | 4 | 5 | 6 |
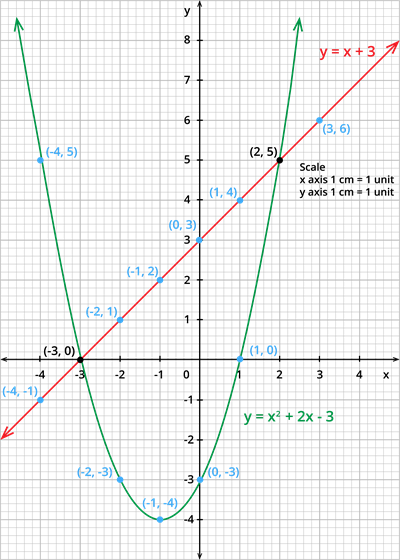
Step 4: Mark the points of intersection of y = x^2 + 2x - 3 and y = x + 3. The point of intersection is (-3,0) and (2,5).
Step 5: The x - coordinates of the points are -3 and 2. Therefore, the solution set for the equation x^2 - x - 6 = 0 is {-3,2}.
2. Draw the graph of y = 2x^2 + x - 2 and hence solve 2x^2 = 0.
Step 1: Draw the graph of the equation y = 2x^2 + x - 2.
The table of values for the equation y = 2x^2 + x - 2 is given by:
| x | -2 | 0 | 2 |
| y | 4 | -2 | 8 |
Step 2: To solve the equation 2x^2 = 0, subtract 2x^2 = 0 from y = 2x^2 + x - 2.
y = 2x^2 + x - 2
0 = 2x^2 (-)
-------------------------------
y = x - 2
-------------------------------
Step 3: Draw the graph of the equation y = x - 2.
The table of values for the equation y = x - 2 is given by:
| x | -2 | -1 | 0 | 1 | 2 | 3 |
| y | -4 | -3 | 2 | -1 | 0 | 1 |
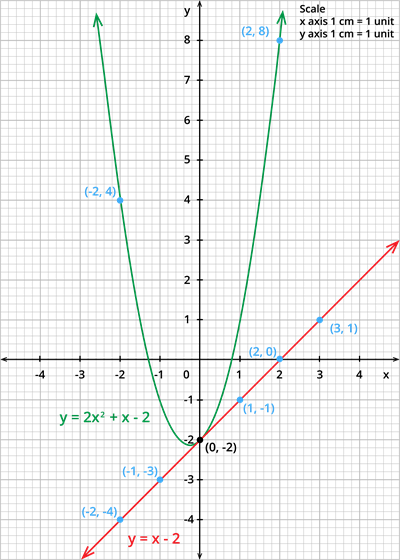
Step 4: Mark the points of intersection of y = 2x^2 + x - 2 and y = x - 2. The point of intersection is (0,-2).
Step 5: The x - coordinates of the points is 0. Therefore, the solution set for the equation 2x^2 = 0 is 0.
 Register for free to see more content