PUMPA - SMART LEARNING
எங்கள் ஆசிரியர்களுடன் 1-ஆன்-1 ஆலோசனை நேரத்தைப் பெறுங்கள். டாப்பர் ஆவதற்கு நாங்கள் பயிற்சி அளிப்போம்
Book Free DemoThe following steps are used to draw a simple bar diagram:
Step 1: Draw two perpendicular lines, one horizontally and the other vertically, at an appropriate place on the paper.
Step 2: Take the basis of classification along the horizontal line (x-axis) and the observed variable along the vertical line (y-axis), or vice versa.
Step 3: Mark signs of equal breadth for each class and leave equal or not less than half a breadth between two classes.
Step 4: Finally mark the values of the given variable to prepare required bars.
Let's consider the data that involved only one variable in it.
The data given below shows the number of people living in a particular street who completed their graduation in the following degree:
Degree | Number of people |
B. A. | 10 |
B. Com. | 28 |
B. E. | 37 |
B. Sc. | 23 |
B. D. S. | 2 |
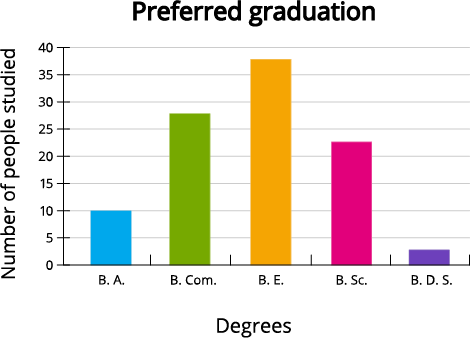
Let's follow the steps and draw the bar graph for the given data.
Step 1: Draw two perpendicular lines one horizontally for the degrees like B. A., B. Com., B. E., B. Sc., and B. D. S. and the other will be vertically for the number of people studied.
Step 2: The horizontal line will take the degrees with equal spaces between them and the vertical line takes the number of people from 0 to 40 (as the maximum number is 37).
Step 3: Mark signs of equal breadth for each class and leave equal or not less than half a breadth between two classes.
Step 4: Now mark the values (10, 28, 37, 23 and 2) of the given degrees B. A., B. Com., B. E., B. Sc., and B. D. S. and form the rectangular bars in it. Thus, we constructed a simple bar graph with one variable.
Step 5: Now write the title as 'Preferred graduation' and the axes label becomes 'Degrees' along the x-axis and 'Number of people' along the y-axis.

The concept of the double bar graph is beyond grade 6 level. So let us ignore that now.