PDF chapter test TRY NOW
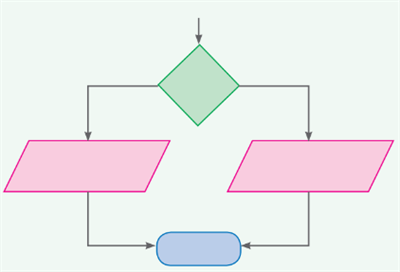
Complete the given flowchart.
(i) Fill in the flow chart to print the average mark by giving your I term or II term marks as inputs.

2. Construct the flow chart to print teachers comment as "very good" if your average mark is above 75 out of 100 or else, as "still try more" can be inserted in the flow chart with earlier one.

Important!
This is a self-assessment task. Solve this question and assess the solution steps after completing the test on your own.
