
PUMPA - SMART LEARNING
எங்கள் ஆசிரியர்களுடன் 1-ஆன்-1 ஆலோசனை நேரத்தைப் பெறுங்கள். டாப்பர் ஆவதற்கு நாங்கள் பயிற்சி அளிப்போம்
Book Free DemoA paint company asked a group of students about their favourite colours and made a pie chart of their findings. Use the information to answer the following questions.
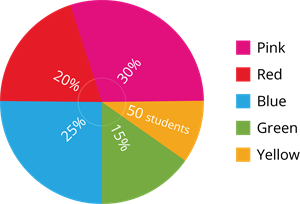
1. How many students did not like red colour?
2. How many students liked pink or blue colour?
3. How many students were asked about their favourite colours?
 Register for free to see more content