
PUMPA - SMART LEARNING
எங்கள் ஆசிரியர்களுடன் 1-ஆன்-1 ஆலோசனை நேரத்தைப் பெறுங்கள். டாப்பர் ஆவதற்கு நாங்கள் பயிற்சி அளிப்போம்
Book Free DemoObserve the given histogram and answer the following questions.
Hint: Under weight: less than 30 \ kg; Normal weight: 30 to 45 \ kg; Obese: More than 45 \ kg
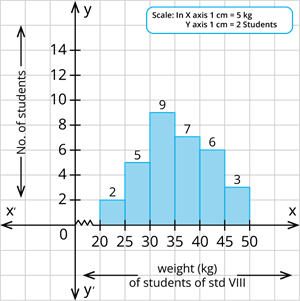
1. What information does the histogram represent?
2. Which group has maximum number of students?
3. How many of them are under weight?
4. How many students are obese?
5. How many students are in the weight group of 30 - 40 \ kg?
 Register for free to see more content