PUMPA - SMART LEARNING
எங்கள் ஆசிரியர்களுடன் 1-ஆன்-1 ஆலோசனை நேரத்தைப் பெறுங்கள். டாப்பர் ஆவதற்கு நாங்கள் பயிற்சி அளிப்போம்
Book Free DemoIn all the cases, the scale value may not be the same to plot a graph. Two different scales have to be chosen for the quantities on x-axis and y-axis, depending on the given data.
Motion of a bus
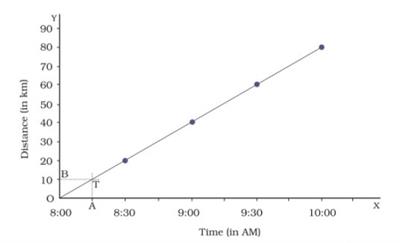
Here, the motion of a bus is taken as an example to plot a distance-time graph.

The time and the distance travelled by the bus is given in the following table.
Time (AM) | Odometer reading (km) | Distance (km) |
8 : 00 | 36500 | 0 |
8 : 30 | 36520 | 20 |
9 : 00 | 36540 | 40 |
9 : 30 | 36560 | 60 |
10 : 00 | 36580 | 80 |
The total distance covered by the bus is 80\ km. If a scale is chosen as 1\ km = 1\ cm, then an axis of length 80\ cm should be drawn. But it is not possible to draw in a sheet of paper. So, a scale of 10\ km = 1\ cm can be used to show an axis of length 8\ cm which is possible to draw in a paper. But, this graph covers only a small part of the graph.
Certain points to choose a suitable scale for drawing a graph:
- the difference between the highest and the lowest values of a quantity.
- the intermediate values of each given quantity, and
- the utilisation of the maximum part of the paper.
Keeping these points in mind, a distance-time graph can be drawn with any value of scale.

- To find the distance covered by a bus at 8 : 15 AM, a point (A) is marked corresponding to the time on the x-axis.
- A perpendicular line (T) is drawn to the x-axis at A so that they intersect each other.
- A line parallel to the x-axis intersects the y-axis at the point (B) is drawn through T.
- Thus, the line OB gives the distance covered by the bus at 8 : 15 AM.
Shapes of graph:

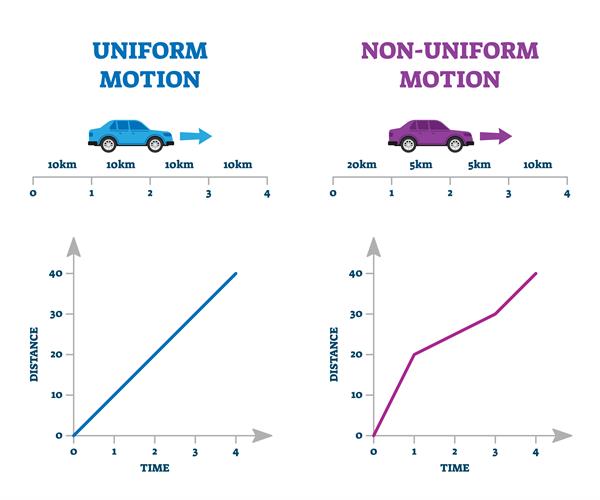
The straight line in the distance-time graph represents that the object is in uniform motion. If the line is not uniform (curvy or irregular), then the object is in non-uniform motion.
Advantages of the distance-time graph
- It provides information about the motion of any object, i.e., the distance moved at a definite time interval.
- It helps to find the distance covered at any specific time interval.