
UPSKILL MATH PLUS
Learn Mathematics through our AI based learning portal with the support of our Academic Experts!
Learn moreGraphs are an efficient way of visualizing curves and functions.
Let us discuss how to identify the graphs of a linear function.
Linear function:
A function f: \mathbb{R} \rightarrow \mathbb{R} defined by f(x) = mx + c, m \neq 0 is called a linear function.
The graph of a linear function simply represents a straight line.
Let us further discuss some specific linear functions.
- Identity function
- Additive inverse function
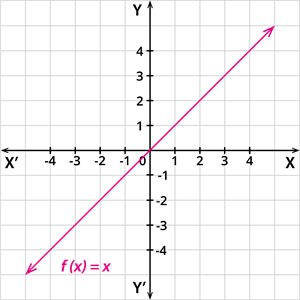
Identity function:
A function f: \mathbb{R} \rightarrow \mathbb{R} defined by f(x) = x, is called an identity function.
In other words, a linear function having an intercept c = 0 and a slope m = 1 is called an identity function.
The graphical representation of the identity function is given by:
 |
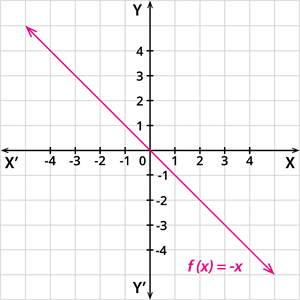
Additive inverse function:
A function f: \mathbb{R} \rightarrow \mathbb{R} defined by f(x) = - x, is called an additive inverse function.
In other words, a linear function having an intercept c = 0 and slope m = -1 is called an additive inverse function.
The graphical representation of the identity function is given by:
 |
Important!
The linear functions are always one-to-one functions.
 Register for free to see more content