PDF chapter test TRY NOW
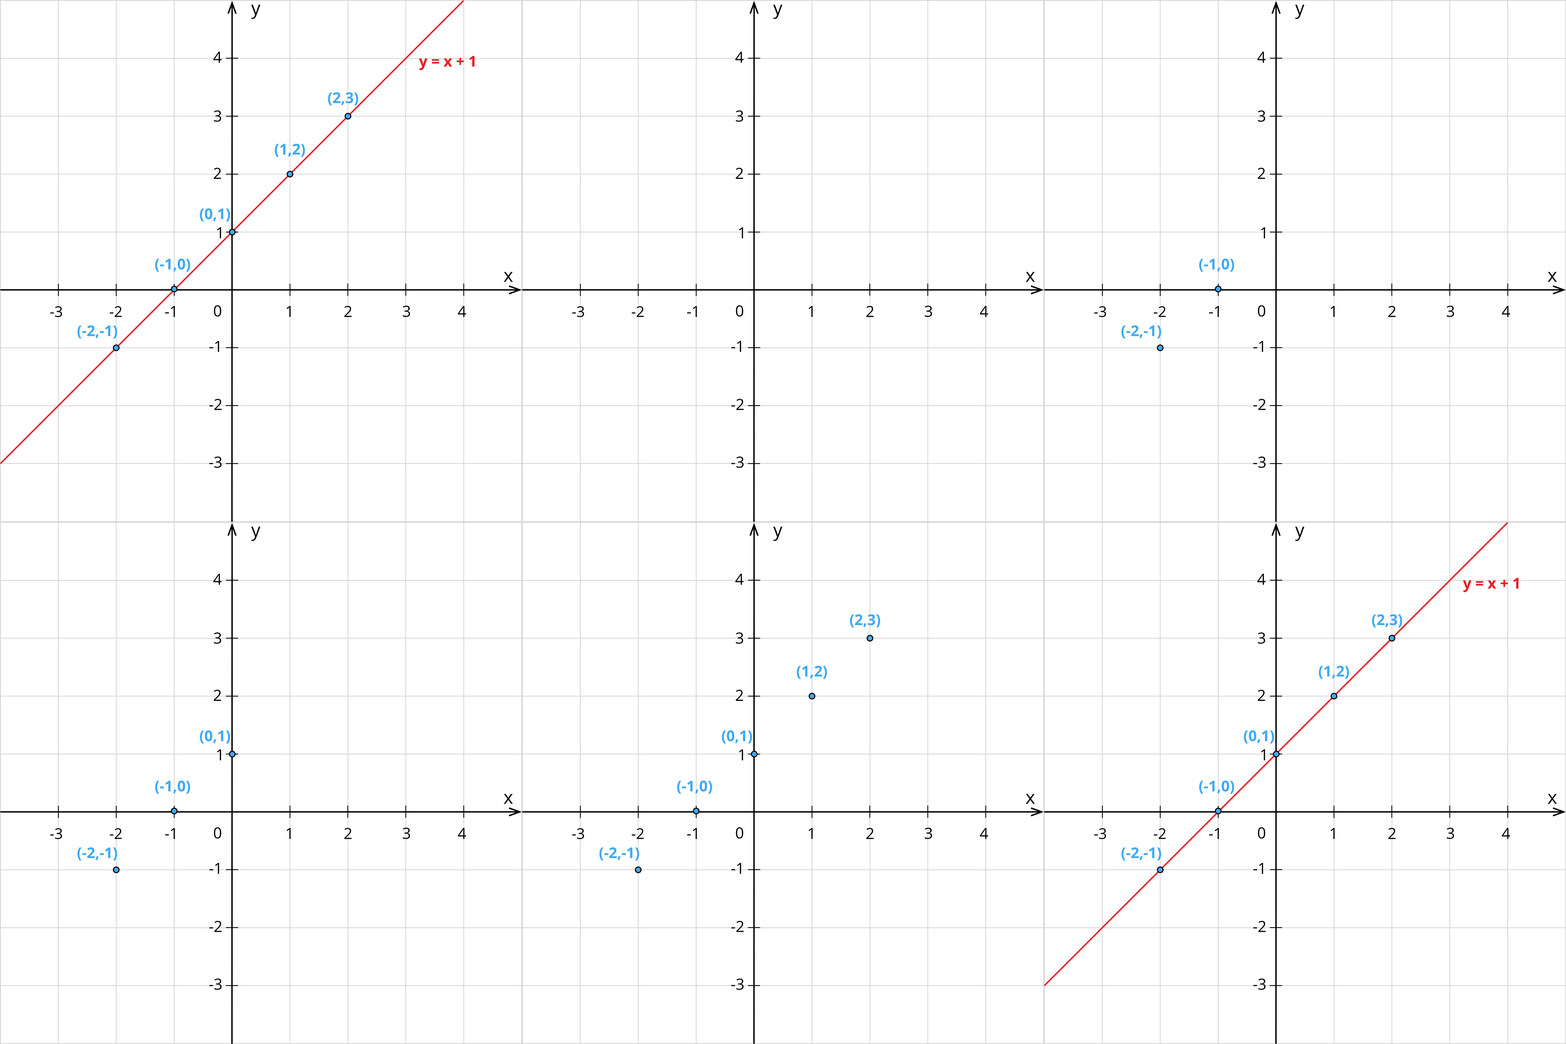
Let us consider the equation y = x+1. Now, let us graph the equation.
First, to plot the points in the graph, we need the ordered pairs. To find the ordered pairs, let us substitute values for x.
The equation is y = x+1.
When x = -2, y = -2+1 = -1
When x = -1, y = -1+1 = 0
When x = 0, y = 0+1 = 1
When x = 1, y = 1+1 = 2
When x = 2, y = 2+1 = 3
Therefore, the ordered pairs are (-2,-1), (-1,0), (0,1), (1,2), (2,3).
Now, let us plot these ordered pairs in the graph and join them.
Here, the scale is x-axis 1 \ cm =1 \ unit and y-axis 1 \ cm = 1 \ unit.

