
PUMPA - SMART LEARNING
எங்கள் ஆசிரியர்களுடன் 1-ஆன்-1 ஆலோசனை நேரத்தைப் பெறுங்கள். டாப்பர் ஆவதற்கு நாங்கள் பயிற்சி அளிப்போம்
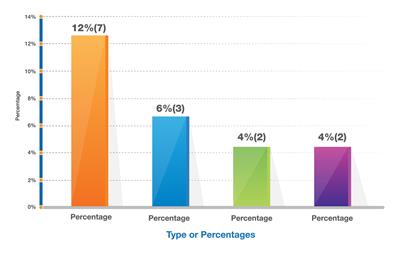
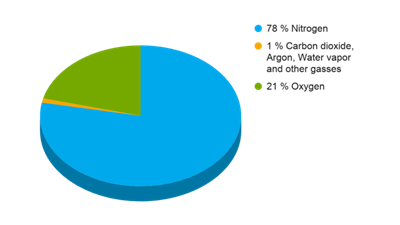
Book Free DemoA graph is generally used to make information interesting and easy to understand. In the newspapers and magazines, the current information is shown in the various forms of graphs such as bar graph, pie chart and line graph.

Distance-time graph
The distance-time graph is a form of line graph.
A distance-time graph shows the change in the distance covered by an object with respect to time. It is a pictorial representation of the motion of objects.
Steps to plot a graph
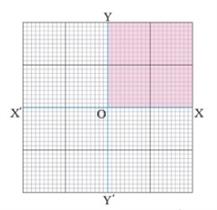
- In a graph sheet, draw two lines perpendicular to each other.
- The horizontal line, known as the \(x\)-axis, is marked as \(XOX'\). Similarly, the vertical line, known as the \(y\)-axis, is marked as \(YOY'\).
- The origin \(O\) is marked at the centre point of intersection of \(XOX'\) and \(YOY'\).
- These two-axis denotes the quantities for which the graph is to be drawn.
- The line \(OX\) denotes the positive values on the \(x\)-axis, and \(OY\) denotes the positive values on the \(y\)-axis.
- Only the positive values are used to denote the quantities, so that part alone is shaded to differentiate from the other quadrants.
Motion of the car
The data is shown here for an example.
| S.No | Time (\(min\)) | Distance (\(km\)) |
1. | \(0\) | \(0\) |
2. | \(1\) | \(1\) |
3. | \(2\) | \(2\) |
4. | \(3\) | \(3\) |
5. | \(4\) | \(4\) |
6. | \(5\) | \(5\) |
Plotting a distance-time graph
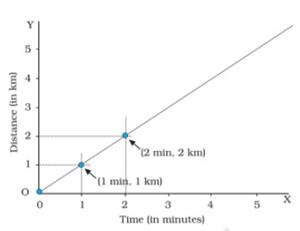
A distance-time graph can be made for the given data by following the steps.
- Two perpendicular lines are drawn to represent the two axes as \(OX\) and \(OY\).
- Here, time is the quantity taken along the \(x\)-axis, and the distance is taken along the \(y\)-axis.
- To represent the quantity of distance and time on the graph, a scale is chosen. Here, the scale for the motion of the car is given as
Time: \(1\ min\) \(=\) \(1\ cm\)
Distance: \(1\ km\) \(=\) \(1\ cm\)
According to the chosen scale, the values are given for the time and the distance quantity on the respective axes. - The value for the time on the \(x\)-axis from the origin \(O\) is given as \(1\ min\), \(2\ min\), … likewise, the value for the distance on the \(y\)-axis from the origin \(O\) is given as \(1\ km\), \(2\ km\) …
- From the given table, the values for distance and time are marked on the graph.
- The first value for time and distance in the given table is \(0\). Hence, the point corresponding to this value is the origin point (\(O\)) in the graph.
- The car has now covered a distance of \(1\ km\) after \(1\ min\).
- Draw a line parallel to the \(y\)-axis to meet the point of \(1\ min\) which is drawn parallel to the \(y\)-axis from the \(x\)-axis. The intersection of points represents the given set of values on the graph.
- Similarly, all the points are marked on the graph corresponding to different sets of values.
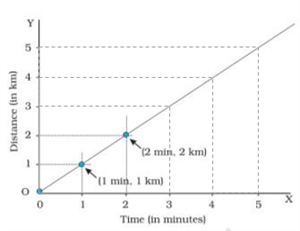
When all the points on the graph are joined, it forms a straight line. This straight line is called the distance-time graph. This graph indicates the motion of an object at a constant speed. The shape of the graph changes according to the speed of the object.