PDF chapter test TRY NOW
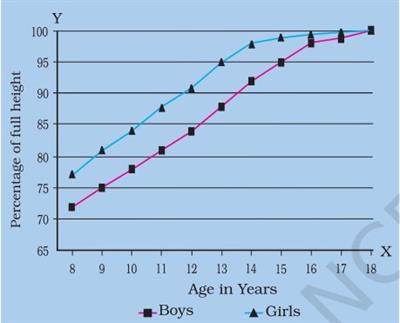
There is a sudden increase in the height of boys and girls during adolescence. The elongation of bones of arms and legs makes the person tall. At first, the girls grow faster than that the boys. By about \(18\), both the boys and girls reach their maximum height.
The maximum height of the boys is slightly higher or more than that of girls. The rate of growth in height varies from individual to individual. Some of them grow suddenly at puberty and then slow down. In contrast, some of them grow gradually.
Sometimes the hands and feet of adolescent girls and boys might look oversized and out of proportion with the body. But the other parts then catch up and grow to form a proportionate body.
Sometimes the hands and feet of adolescent girls and boys might look oversized and out of proportion with the body. But the other parts then catch up and grow to form a proportionate body.
The height of an individual also depends on the genes which are inherited from their parents.
Age in years | \(\%\) of full height in boys | \(\%\) of full height in girls |
| \(8\) | \(72\%\) | \(77\%\) |
| \(9\) | \(75\%\) | \(81\%\) |
| \(10\) | \(78\%\) | \(84\%\) |
| \(11\) | \(81\%\) | \(88\%\) |
| \(12\) | \(84\%\) | \(91\%\) |
| \(13\) | \(88\%\) | \(95\%\) |
| \(14\) | \(92\%\) | \(98\%\) |
| \(15\) | \(95\%\) | \(99\%\) |
| \(16\) | \(98\%\) | \(99.5\%\) |
| \(17\) | \(99\%\) | \(100\%\) |
| \(18\) | \(100\%\) | \(100\%\) |
The table shows only representative figures and there maybe variations present individually.
For calculating full height in (\(cm\))
\(\%\) of full height at the age value is taken from the chart. For example, for age \(16\) in boys, it is \(98\%\)
With the help of the formula, we can calculate the total height that the boy or girl can reach from that age.
Using the table, we can plot a graph where the age is taken on the X-axis, and the \(\%\) of growth in height is taken on the Y-axis. So a graph can be observed as follows wherein the point to represent can highlight the present age.

Graphical representation of age in years
Image credits: Reaching the age of adolescence
