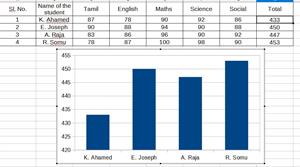
PDF chapter test TRY NOW
One of the most popular features of LibreOffice Calc software is to generate charts based on numeric data.
The purpose of charts is to visualize the data for easy understanding.
To draw a chart, follow the procedure given below:
- Select the data for which you want to draw a chart.
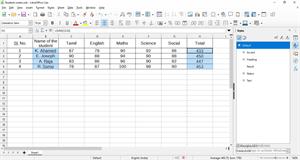
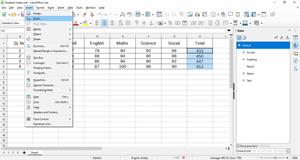
- Click on Insert Chart or click on the InsertChart icon on the standard toolbar.
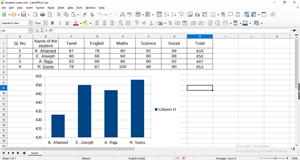
To choose a chart type:
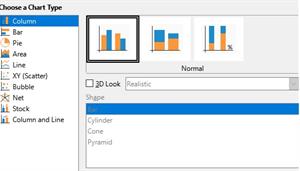
- Choose a basic chart type: click on one of the types labelled Column, Bar, Pie, and so on.
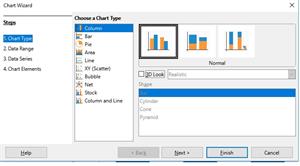
- The contents on the right side will switch to offer more options depending on the basic chart type.
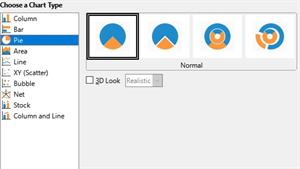
- Click Next to view the next wizard page, or click the options on the left side of the wizard to go to that particular page.

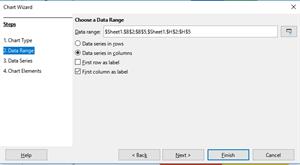
- Click Finish on any wizard page to close the wizard and generate the chart using the present settings.
